


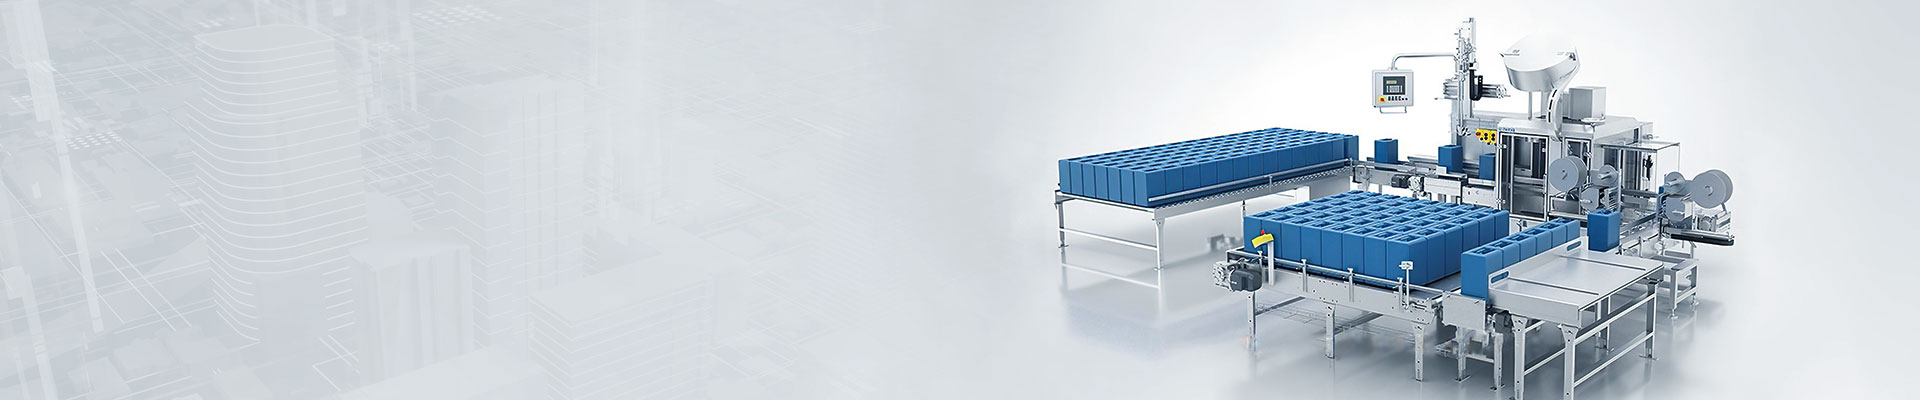


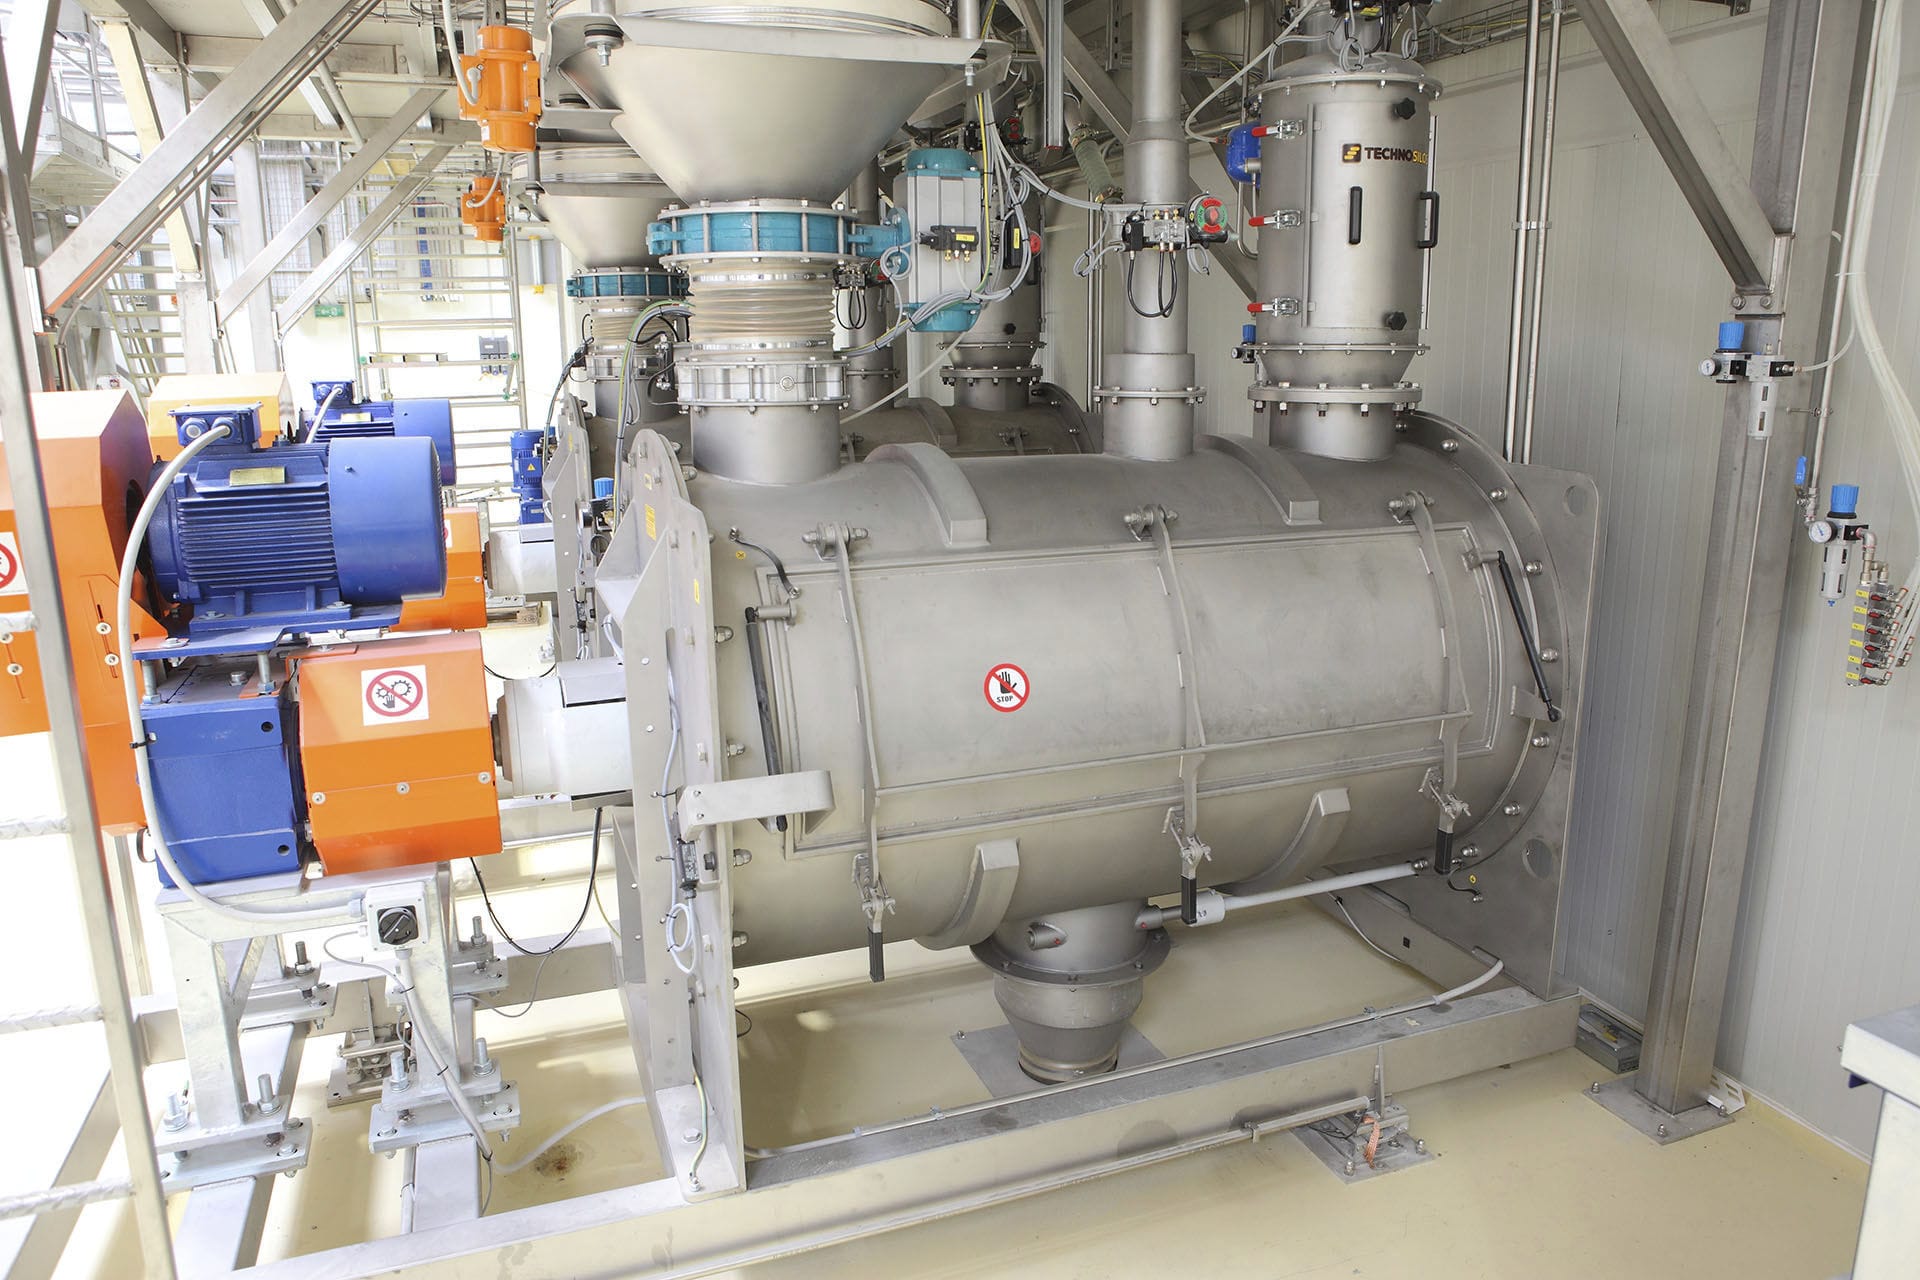


The Conduction weighing and mixing system collects the weighing signals of each dosage scale in real time, can automatically tare, automatically calibrate zero and automatically correct the error, and selects and controls the dosage according to the specified formula ratio and relevant algorithms, and judges at any time and sends out the switching signals to the corresponding feeder, electronic weighing door, and mixing machine door. In the process of dosage, it is an important guarantee for safe production to detect the operation status of controlled equipment and find out the problems in time. The system can dynamically detect the status of drive motor, travel switch and other equipments of each feeder and electronic weighing gate, and alarm immediately once errors and failures are found.


 020-34563445
The conductive weighing and mixing system is a product of the combination of microcomputer technology and relay conventional control technology. It is a dedicated industrial control machine with a microprocessor as the core for the control of the feeding system. It adopts the FX2N type programmable controller. To achieve dynamic monitoring of the production process, the microcomputer system machine communicates with the FX2N. Dynamic production and data are displayed on the color screen.
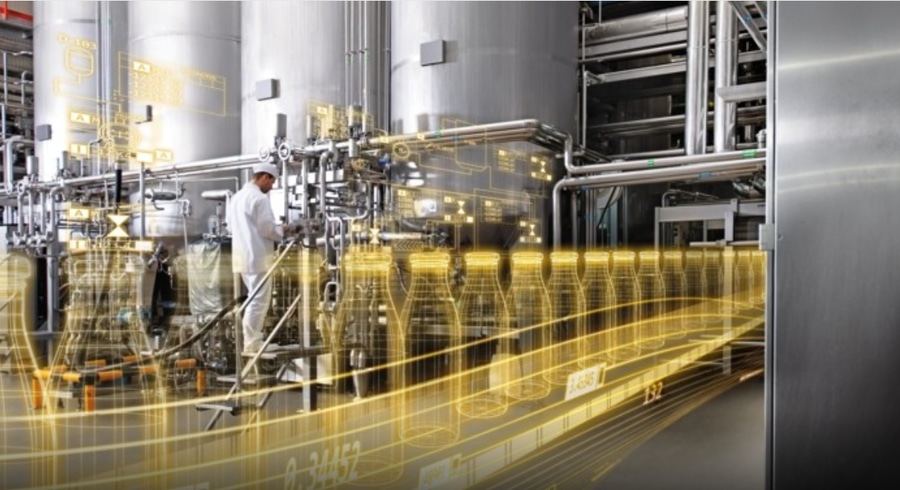
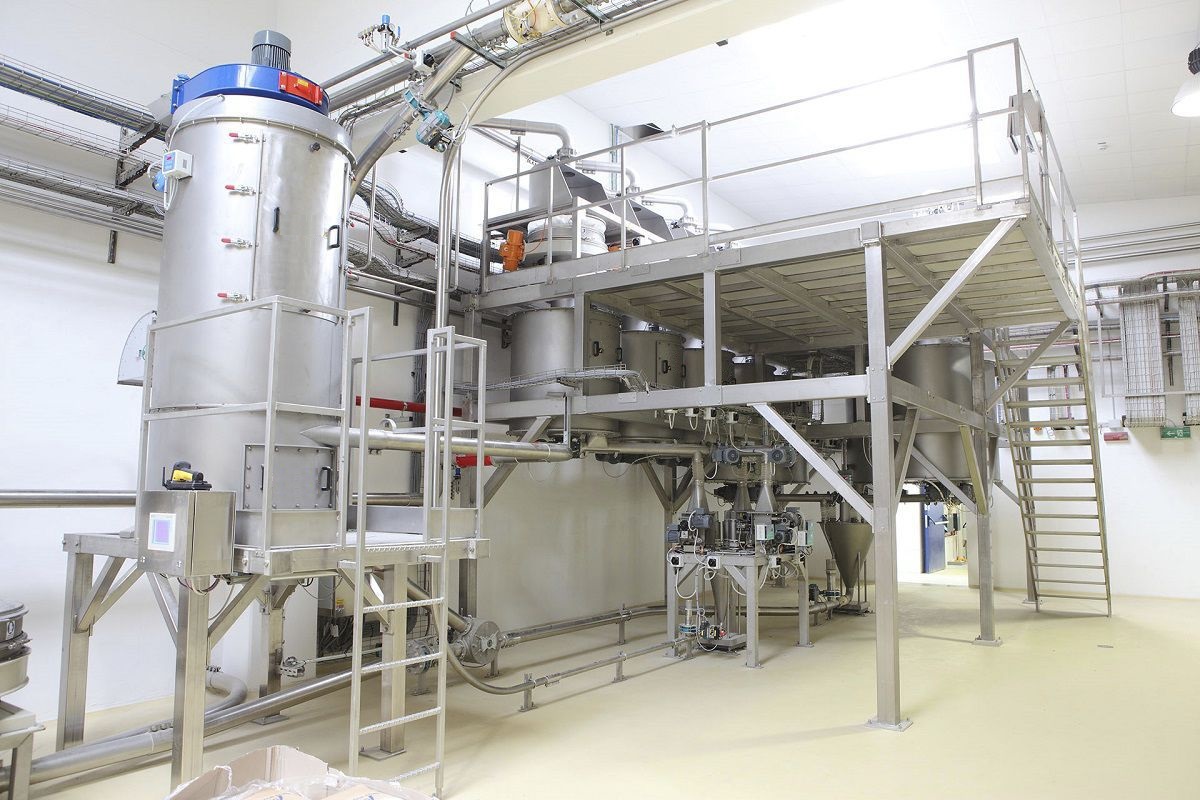
The weight of raw materials on each batching scale is detected. The Feeder adopts a screw type. The PLC controls the start and stop of the motor of the feeder corresponding to each material through the corresponding control software according to the arranged feeding sequence. The amount of ingredients is determined by the formula calculation. The upper computer can dynamically display the weight signal of each batching scale and has the display of the motor switch status corresponding to each feeder. Meanwhile, the upper computer accomplishes functions such as formula management, report display, query, and printing.
According to the process requirements, there are three levels of passwords for the operator, process operator and chief engineer, and each process parameter is saved and reports are processed. It ensures system security, strengthens production management, and provides a basis for the assessment of the economic responsibility system.
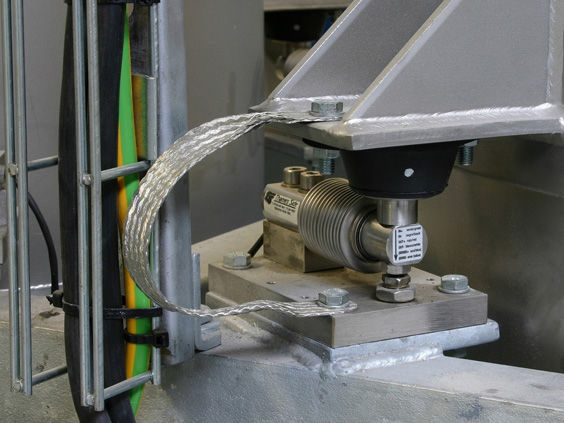
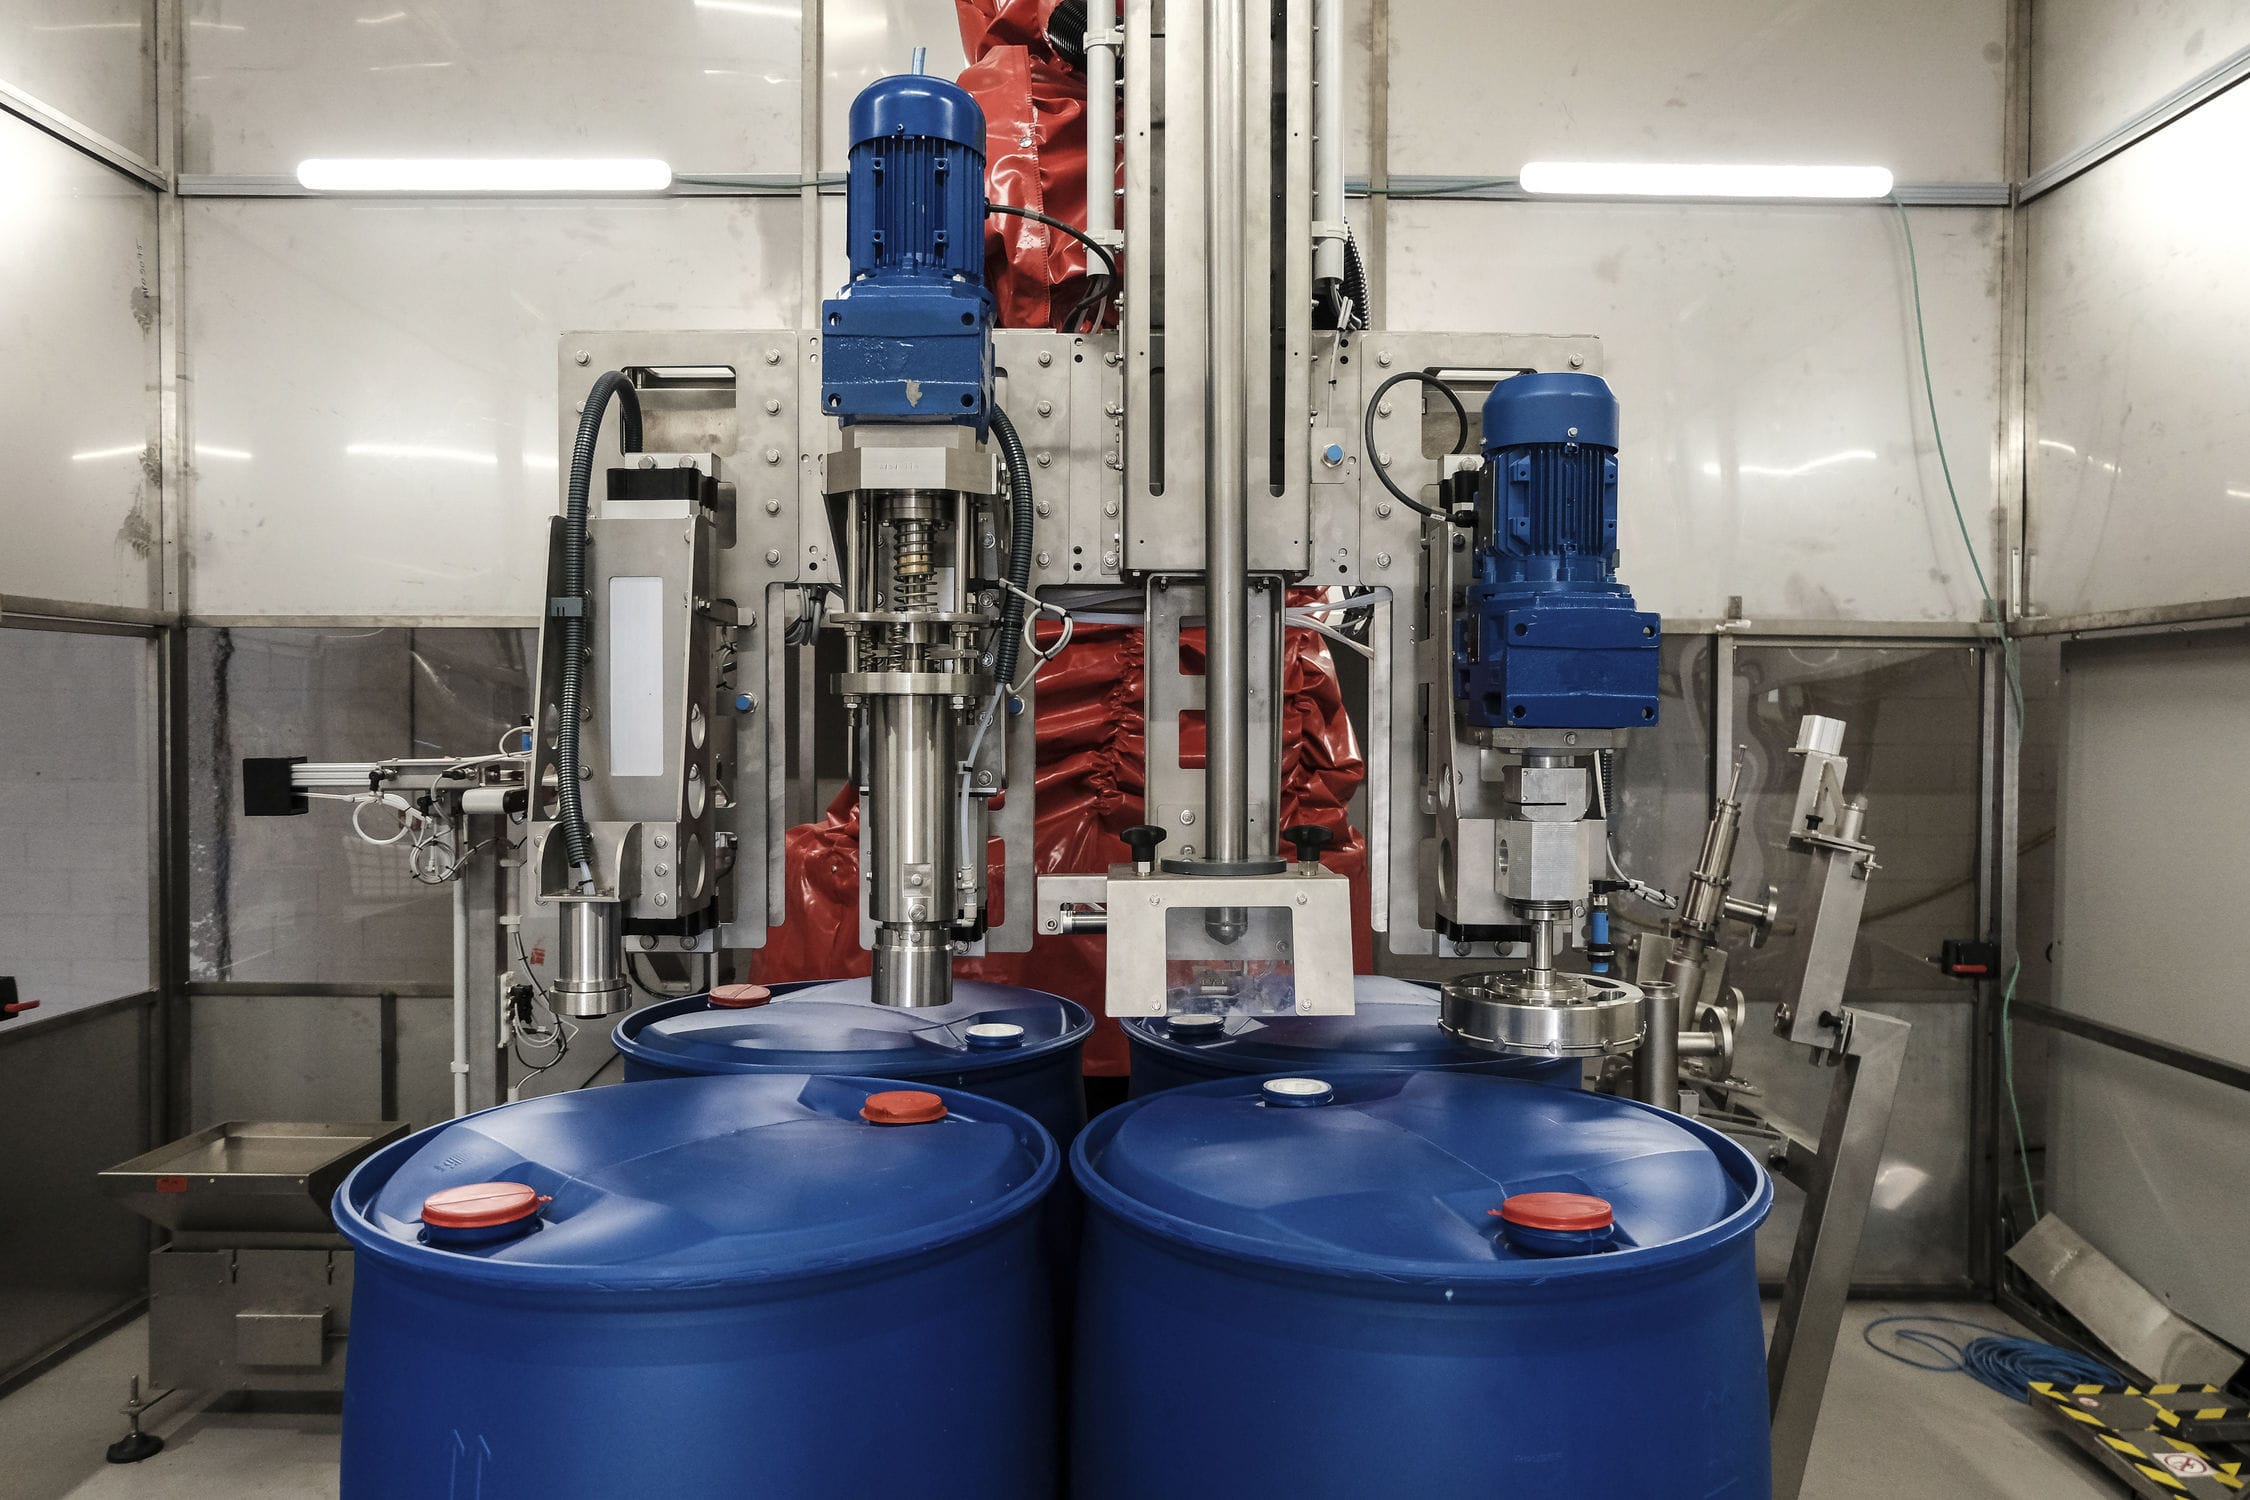
The weighing module is selected to detect the weight signals of the two Batching systems respectively, and the analog signal of the weighing module is transmitted to the weighing instrument for display. The PLC receives the BCD code output by the weighing display instrument to obtain the weight signal of the raw materials. When switching input signals, to prevent the digital signals entering the PLC from causing misoperation of the control system due to interference, anti-interference measures have been added in the software development to enhance the reliability of the system. The relay output module is selected. For loads with large currents, an external relay is added for amplification and isolation to ensure the safe operation of the main PLC. The RS-232 port on the CPU of the PLC is used to communicate with the upper computer.


